Your Accountant Can Tell You What Happened in Your Agency. These KPIs Tell You What's About to Happen.

There is a version of your agency that looks completely healthy from the outside. Revenue is up. Invoices are going out. The team is busy. Your accountant files clean returns and sends you tidy year-end summaries.
And then, somewhere in the middle of a growth phase, you run out of cash.
This is not a hypothetical. It is one of the most common financial shocks we see agency owners walk into, and almost every time, the warning signs were there. They just weren't being tracked.
The problem with traditional accounting is that it is, by design, a backward-looking exercise. Your accountant tells you what happened last month, last quarter, last year. That information matters. But it does not tell you that your largest client represents 40% of your revenue and is up for renewal in 90 days. It does not tell you that your team's billable utilization has been quietly sliding for three months. It does not tell you that the two senior hires you made to staff a new service line are still ramping, and your effective billing rate has dropped as a result.
Those are the numbers that predict what happens next. And most agency owners are not looking at them on any kind of regular schedule.
This post is about changing that.
Why Growth Is When the Numbers Lie the Loudest
The cash flow story deserves more attention than it gets in most agency content.
You can run a genuinely profitable agency and still run out of cash. This happens most reliably during growth phases, and the mechanism is straightforward: you hire ahead of the revenue. You bring on new professionals for projects you expect to win or service lines you're standing up. Those people take time to train. They take time to ramp. For weeks or months, you are carrying their full cost without getting full productivity in return. Some of them don't work out, and you absorb the cost of that too.
Meanwhile, your invoicing cycle has not changed. Clients pay on their schedule. Retainer renewals land when they land. The gap between your outgoing payroll and your incoming revenue widens exactly when you feel most optimistic about the business.
This is why a profitable agency with strong revenue can still face a genuine liquidity crisis. Profitability is a lagging indicator. Cash flow is a leading one. And the KPIs below are the instruments that give you visibility into which direction you're heading before the bank account tells you.
The Governance Problem Nobody Talks About
Before we get into the metrics themselves, there is a structural issue worth naming directly.
Most agencies have a bookkeeper handling data entry and reconciliation, and senior leadership making strategic decisions. The gap between those two functions is where financial intelligence goes to die.
Your bookkeeper is not positioned to interpret what your utilization trend means for your Q3 hiring plan. Your CEO is not going to pull a custom report from your project management software every Monday morning. So the KPIs that would connect operational reality to strategic decisions simply don't get calculated. Not because nobody cares, but because nobody owns the cadence.
The solution has two layers. First, you need a strategically oriented person, a fractional CFO, your CEO, or a senior internal operator, who defines which KPIs are actually worth tracking based on the specific goals your agency is trying to achieve. The metrics below are a strong starting point, but the right dashboard for a 10-person content agency looks different from the one for a 40-person full-service shop. Someone with strategic context has to make that call.
Second, you need someone senior enough to go beyond data entry but operationally focused enough to own the execution: pulling reports from your time tracking software, your project management tool, and your accounting platform, then synthesizing them into something interpretable. At Zenbooks, we call this function a virtual controller. It is the role that bridges the gap between raw financial data and the leadership insights your team actually needs to make decisions.
Without both layers, KPI tracking becomes either a theoretical exercise (everyone agrees the numbers matter, nobody runs them) or a data dump (reports get generated, nobody knows what to do with them).
The KPIs That Predict Your Agency's Financial Future
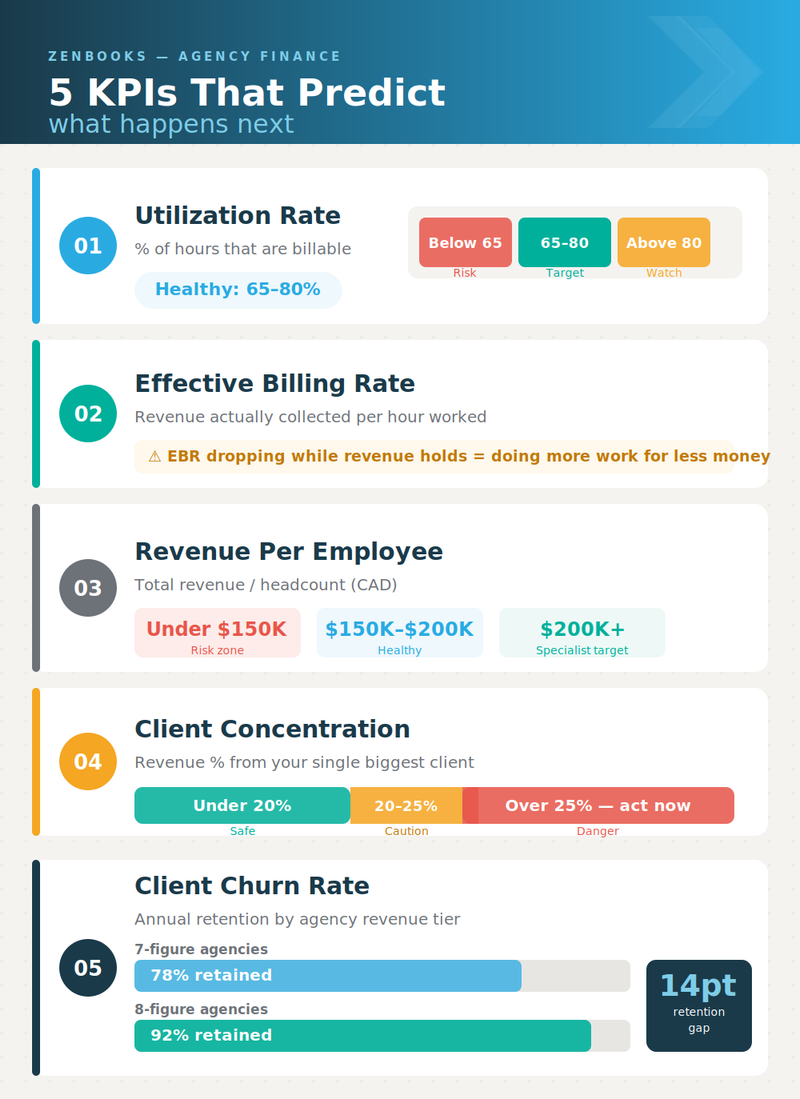
1. Utilization Rate
**What it is:** The percentage of your team's available hours that are spent on billable client work.
**Why it's a leading indicator:** A drop in utilization rate does not show up as a problem in your revenue figures immediately. You might still be invoicing at full capacity against existing retainers. But three months later, when those projects wrap and the pipeline hasn't been fed, the revenue shortfall arrives. Utilization is the early warning signal.
**The benchmark:** Industry data consistently places the healthy range for marketing and creative agencies at 65-80% (Runn, Parakeeto, WordStream). At Zenbooks, our agency clients who maintain utilization in this range consistently show healthier gross margins and more predictable cash flow than those operating below it. Below 65% on a sustained basis is not a capacity problem. It is a scoping, pricing, or pipeline problem that needs a strategic response, not a staffing adjustment.
**What good looks like:** Utilization is tracked weekly, not monthly. Senior staff and junior staff have different targets (senior and leadership roles typically run 50-65% given their business development and management responsibilities; junior delivery staff should be closer to 75-85%). The number is owned by someone and reviewed on a set cadence.
**The governance note:** This is one of the metrics most commonly missing from agency dashboards, not because it is hard to calculate, but because it requires pulling from time tracking software that the bookkeeper doesn't touch and the CEO doesn't have time to mine. A virtual controller bridges that gap.
2. Effective Billing Rate (EBR)
**What it is:** The actual revenue earned per hour worked on client projects, across all billable staff. Not your quoted rate. Not your rate card. What you actually collected divided by the hours actually spent.
**Why it's a leading indicator:** Your rate card is a fiction until it survives contact with scope creep, rush revisions, underestimated projects, and the junior hours that get written off because you're embarrassed to invoice for them. Your EBR is the truth. When it starts declining, even while your invoiced revenue holds steady, you are doing more work for the same money. That trend, left unaddressed, compresses your margins quarter by quarter.
**The benchmark:** A healthy EBR depends on your market and service mix, but the directional signal matters more than the absolute number. According to our national study of 500 Canadian SMEs conducted with Abacus Data, businesses that actively track financial metrics report meaningfully stronger outcomes than those operating on gut feel alone. For agencies specifically, we see EBR tracked monthly by the highest-performing clients in our portfolio. Agencies that only look at it annually are typically surprised by what they find.
Most agencies think they're profitable until they calculate their effective billing rate. Then they find out they've been subsidizing their clients.
**What good looks like:** EBR is calculated monthly, broken down by client and by project type. Outliers (projects where EBR fell below a threshold) are reviewed to determine whether the issue was scoping, execution, or pricing, and that learning feeds into the next proposal.
3. Revenue Per Employee (RPE)
**What it is:** Total revenue divided by full-time equivalent headcount. Simple. Ruthlessly revealing.
**Why it's a leading indicator:** Revenue per employee is the single cleanest measure of whether your agency model is actually working. It tells you whether you are scaling efficiently or just adding cost. When RPE is rising, your systems, your pricing, and your service delivery are improving faster than your headcount. When it is flat or declining during a growth phase, you are adding people without adding proportional value, and that is a margin problem in the making.
**The benchmark:** According to Promethean Research's 2024 digital agency industry data, the average digital marketing agency generates over $163,000 USD per full-time employee. Agency consultant Karl Sakas places the healthy range at $180,000 USD and above for generalist agencies, with specialists targeting $250,000 USD and above. Agencies falling below $120,000 USD face significant risk given how little margin remains after payroll. In Canadian dollar terms and adjusted for agency type, we use $150,000-$200,000 CAD as a reasonable benchmark for the agencies we work with, with high-performing specialist shops regularly exceeding that range. Most of our agency clients who are hitting their growth targets are operating at or above the $175,000 CAD mark.
**What good looks like:** RPE is reviewed quarterly as part of a broader efficiency review. It is tracked over time, not as a snapshot, so you can see whether growth is accretive or dilutive to your model.
4. Client Concentration
**What it is:** The percentage of your total revenue that comes from any single client.
**Why it's a leading indicator:** Client concentration is not a problem until it suddenly, catastrophically is. A client who represents 35% of your revenue can leave. They can get acquired. They can bring their marketing in-house. They can simply decide to go in a different direction. When that happens, no amount of strong financials from the previous quarter helps you make payroll next month.
**The benchmark:** The threshold where we start having a direct conversation with clients is 20-25% from a single client. This is consistent with benchmarks from Wall Street Prep, Sakas & Company, and Allianz Trade, all of which converge on 20% as the point where concentration becomes a material financial risk. If your top three clients account for more than 50% of total revenue, that is a separate but equally urgent conversation. In our experience, agencies in this position often don't realize how exposed they are because the relationships feel stable. Relationships always feel stable until they aren't.
If your biggest client represents more than 25% of your revenue, you don't have a business. You have a dependency.
**What good looks like:** Client concentration is calculated monthly. It is part of the standard dashboard review, not an annual exercise. When a single client approaches the 20% threshold, the business development response begins immediately, not after the client gives notice.
5. Average Client Lifespan and Churn Rate
**What it is:** How long clients stay, and at what rate they leave.
**Why it's a leading indicator:** Churn has a compounding effect that most agency owners dramatically underestimate. Losing a client does not just reduce your current revenue. It reduces the base from which you grow. It also consumes enormous internal resources, pitching, onboarding, relationship building, that do not show up as a line item in your financial statements but absolutely affect your capacity and your margins.
**The benchmark:** According to a 2025 benchmark report from Predictable Profits analyzing over 300 agencies, eight-figure agencies retain 92% of clients annually, compared to 78% for seven-figure agencies. That 14-point retention gap is not a relationship management difference. It is a systems and financial visibility difference. Agencies that track churn proactively build the early warning systems that allow them to intervene before a client relationship deteriorates. The agencies in our portfolio with the strongest retention rates are, without exception, the ones who review client health metrics on a monthly cadence rather than responding to problems after they surface.
**What good looks like:** Average client lifespan is calculated by service tier. Churn rate is tracked monthly. At-risk clients (flagged by declining scope, slower payment, reduced responsiveness) are identified and escalated before they issue formal notice.
Putting It Together: What a Real Dashboard Looks Like
These five KPIs are not independent of each other. They interact.
A declining utilization rate often predicts an EBR problem two months later. A high client concentration magnifies the cash flow risk in your agency that comes with growth-phase hiring. A deteriorating average client lifespan puts pressure on RPE because the cost of constant re-acquisition erodes the efficiency gains from your delivery model.
The agencies that navigate growth without hitting a cash wall are not the ones with the best accountants. They are the ones with a clear line of sight into these numbers, someone strategic who decided which metrics matter for their specific goals, and someone operationally disciplined who runs those numbers on a schedule and knows what to do when one starts moving in the wrong direction.
According to Zenbooks' national research of 500 Canadian SMEs, nearly 1 in 3 business owners feel they have outgrown their accountant. For agency owners specifically, the gap is rarely about compliance. It is about financial intelligence. The difference between knowing what happened and knowing what is about to happen is the difference between reacting to your business and running it.
Frequently Asked Questions
How often should a marketing agency review its KPIs?
Utilization rate should be reviewed weekly, it moves fast enough that monthly review means you are always catching up to a problem rather than preventing one. Effective billing rate, revenue per employee, and client concentration should be reviewed monthly. Average client lifespan is a quarterly metric, though churn events should trigger an immediate review whenever they occur.
Who should own KPI tracking in a small agency?
In a well-structured agency, a strategically oriented person, the CEO, a fractional CFO, or a senior operator, defines the dashboard based on the agency's current goals. A virtual controller or senior bookkeeper then owns the execution: pulling data from your time tracking, project management, and accounting platforms and presenting it in a usable format. If one person is trying to do both, the strategic interpretation usually suffers. If neither role exists, the numbers simply don't get run.
What's the difference between a bookkeeper and a virtual controller for an agency?
A bookkeeper records transactions and reconciles accounts. A virtual controller interprets financial data, builds management reports, flags anomalies, and produces the kind of operational intelligence that informs decisions. For an agency tracking the KPIs above, a bookkeeper alone is not sufficient. The role that connects raw data to leadership insight is the controller function, whether that is in-house, virtual, or embedded in your accounting firm.
Is a utilization rate of 80% too high?
Not necessarily, but it depends on the role. A junior designer or copywriter at 80-85% utilization is running efficiently. A senior strategist or account director at 80% is probably not doing enough business development, mentorship, or internal work, which creates a different kind of problem downstream. The target should be role-specific, not firm-wide.
How do I calculate my effective billing rate?
Take the total revenue earned from a client or project and divide it by the total hours actually spent on that client or project by all team members. Compare that to your blended hourly cost (fully loaded salaries plus overhead, divided by total billable hours). The gap between those two numbers is your actual margin on that work. If you have never done this calculation at the project level, prepare to be surprised.
What should I do if a single client is above 25% of my revenue?
Do not drop the client. Protect the relationship. But treat the concentration as a four-alarm financial risk that requires an immediate business development response. The goal is not to get below 25% in 30 days. It is to have a credible, funded plan to diversify your revenue base over the next 6-12 months, and to know exactly what your business looks like operationally if that client leaves tomorrow. If you cannot model that scenario confidently, that is the first thing to fix. Zenbooks works with agency clients on exactly this kind of scenario planning as part of our advisory services. Book a free consultation if you want a second set of eyes on your numbers.

Jessica Wong, CPA, CA, is Director of Operations at Zenbooks, where she has led the firm's accounting services and client operations since 2020. She brings over a decade of experience working directly with small and mid-sized business owners, with a focus on building efficient financial processes, improving month-end close cycles, and translating complex numbers into clear operational insights.
Before joining Zenbooks, Jessica held senior accounting roles across the hospitality and professional services sectors, including Corporate Controller at Hawksworth Restaurant Group and Manager of Client Onboarding at a national cloud accounting firm. She began her career in public accounting at Crowe. She holds a Bachelor of Business Administration from Simon Fraser University and her CPA, CA designation.
Jessica's writing on accounting operations and the future of remote work has appeared in the Toronto Star.
Subscribe for Updates


Business Clarity That Helps You Breathe Easy
Achieve your business goals and peace of mind with Zenbooks. As both your finance team and business advisor, we empower you every step of the way.